Create Excel files in MATLAB with Python's openpyxl module
Part 4 of the Python Is The Ultimate MATLAB Toolbox series.
Your latest MATLAB masterpiece produced a goldmine of incisive data and now it’s time to present the results to management. MATLAB Live Scripts are an excellent reporting mechanism but these may not suit an organization’s workflow or documentation standards. Sometimes it’s necessary to fall back to showing results in a basic tool like Microsoft Excel.
MATLAB + Excel = not easy
MATLAB’s ability to create Excel files is modest at best.
The writecell(), writematrix(), and
writetable() functions can populate
an Excel file with data, but only using the default text style.
If you want to change typefaces, fonts, colors, merge cells
and so on, you’re in for some hardship.
Custom formatting is only supported on Windows using the COM layer
(see
Write Data to Excel Spreadsheets, bottom of the page)
and examples demonstrating this process are hard to find.
If you’re using MATLAB on macOS or Linux, you’re completely out of luck writing rich Excel files.
MATLAB + Python + Excel = easy!
If you
include Python with your MATLAB setup on the otherhand, creating richly-formatted Excel files on any platform
is easy. Excel files can be created in MATLAB by calling functions
from the Python
openpyxl
module.
The first step is to check if you have openpyxl and
to install it if you don’t.
Install openpyxl
Check your Python installation to see if it has openpyxl
by starting the Python command line REPL and importing
the module. If it imports successfully you can also check
the version number:
> python
>>> import openpyxl
>>> openpyxl.__version__
'3.0.9'
If you get a ModuleNotFoundError, you’ll need to install it.
That can be done on an Anaconda Python installation with
> conda install openpyxlor with
> python -m pip install openpyxlusing other Python distributions.
Start a new .xlsx file
The small program below creates an empty Excel file,
my_analysis.xlsx, containing two worksheets, or tabs,
called “Amazing Results” and “Summary”.
For special emphasis, the Summary tab’s color is changed to green.
Unfortunately colors in openpyxl must be provided as RGB or aRGB
(‘a’ = alpha, to control transparency) hex values rather
than words like “green”.
Python file: empty.py:
|
|
The MATLAB version is empty.m:
|
|
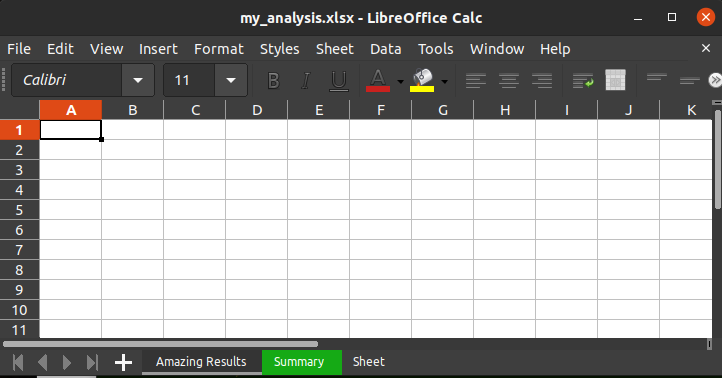
my_analysis.xlsx created by empty.py or empty.m
The create_sheet() method’s arguments are the worksheet’s title
and an optional position in the tab sequence, where 0 is the leftmost tab.
Note the presence of the ‘Sheet’ tab. This was created by default and
was pushed to the right when our sheets were added.
The ‘Sheet’ tab can be deleted like this:
# Python
del book['Sheet']
   #  -  or  -
existing_sheet = book['Sheet']
book.remove_sheet(existing_sheet)
   #  -  or  -
existing_sheet = book.get_sheet_by_name('Sheet')
book.remove_sheet(existing_sheet)
MATLAB won’t let us use [ ] to index the Python book object so only
the third option works there:
% MATLAB
existing_sheet = book.get_sheet_by_name('Sheet');
book.remove_sheet(existing_sheet);
Avoiding bracket notation
As noted above, MATLAB won’t let us index Python objects with brackets.
This prevents us from using openpyxl shortcuts such as
assigning a cell’s value using something like sheet['C8'] = 3.14159.
In Section 7.8 of
Python for MATLAB Development,
I suggested using a bridge
module to overcome this interface limitation.
After the book came out,
David Garrison
at the MathWorks informed me that a bridge
module is unnecessary since openpyxl offers method- and
attribute-based ways to achieve the same thing. Setting cell C8’s
value can also be done with
C8 = sheet.cell(3,8)
C8.value = 3.14159
All examples below use method and attribute access methods
to accomodate MATLAB.
The code examples therefore
don’t demonstrate the most idiomatic use of openpyxl,
but they have the benefits that Python and MATLAB code samples
look almost identical, and that the MATLAB implementation won’t need a bridge module.
Fill a cell with a value
To populate a cell with a number or string, get a handle
to the cell using the worksheet’s .cell() method, pass
it the 1-based row and column indices, then set the
handle’s
.value attribute with the number or string of interest.
These lines put the string “Total” in cell B9 which corresponds to row 2, column 9:
# Python
B9 = sheet_data.cell(2, 9)
B9.value = "Total"
It looks like this in MATLAB:
% MATLAB
B9 = sheet_data.cell(int64(2), int64(9));
B9.value = "Total";
The int64() type casts are necessary because numeric
literals in MATLAB have type double while the Python
function expects integers.
Typeface size, font, color
A cell’s font can be modified by creating a “font style”
with the
Font class
then applying this style to the cell. The code example
below creates a style, ft_title, having a
14 point blue Arial typeface with bold italics font.
# Python
import openpyxl.styles as styles
Font = styles.Font
ft_title = Font(name="Arial", size=14, color="0000FF",
                bold=True, italics=True)
MATLAB 2021b and earlier use pyargs() to set keyword value
pairs:
% MATLAB 2021b and newer
ft_title = Font( pyargs("name","Arial", "size",int64(14),  ...
                        "color","0000FF", "bold",py.True,  ...
                        "italics",py.True) );
MATLAB 2022a and newer can use pyargs() as above or,
even better,
let you assign keyword values the same way as Python:
% MATLAB 2022a and newer
ft_title = Font(name=Arial, size=int64(14), color="0000FF", ...
                bold=py.True, italics=py.True);
The font style can then be applied to the
text in a cell by setting the cell’s .font attribute:
# Python
B9 = sheet_data.cell(2, 9)
B9.value = "Total"
B9.font  = ft_title
and
% MATLAB
B9 = sheet_data.cell(int64(2), int64(9));
B9.value = "Total";
B9.font  = ft_title;
Alignment
Text in a cell can be aligned vertically and horizontally, rotated, indented, and shrunk to fit a given container using the Alignment class. Text in merged cells looks good when it is centered both horizontally and vertically. That can be done with
# Python
import openpyxl.styles as styles
Alignment = styles.Alignment
B9.alignment = Alignment(horizontal="center", vertical="center")
and
% MATLAB 2021b and newer
B9.alignment = Alignment(pyargs("horizontal","center", ...
                                "vertical","center"));
% MATLAB 2022a and newer
B9.alignment = Alignment(horizontal="center", vertical="center");Currency, percent, and other numeric formats
A cell can be formatted to show numeric values as currency or a
percentage through the cell’s .number_format attribute.
The numerical format notation is rather unusual in that it
allows positive values to be formatted diffently than
negative values. If such a distinction is desired,
a semicolon and the negative value format are appended
to the postive value format.
Financial ledgers sometimes show negative values in red and/or in
parentheses so these variations are shown in the example below.
Oddly, one may use words like ‘Red’ or ‘Blue’ to define the color
within a .number_format but all other color definition
options only allow hex values.
The .number_format attribute also controls date format
styles and scientific notation.
See the documentation for numeric styles
for all options.
B9.number_format = '"$"#,##0.00;[Red]("$"#,##0.00)'  # eg  $12,345.67
B9.number_format = '0.0%;[Red]0.0%'                  # eg  98.7%
The dollar symbol can be replaced with other currency symbols
simply by replacing "$" with the desired character — "€" for example.
Cell background color
Cell backgrounds can be set to a variety of colors and
patterns with the
PatternFill
class. Following the same technique as with fonts and number
styles, one first defines a pattern
style then applies this to a cell’s .fill attribute.
The style bg_green defines a solid lime green background
color:
# Python
import openpyxl.styles as styles
PatternFill = styles.PatternFill
bg_green = PatternFill(fgColor="C5FD2F", fill_type="solid")
B9 = sheet_data.cell(2,9)
B9.value = "Total"
B9.font  = ft_title
B9.fill  = bg_green
% MATLAB 2020b and newer
bg_green = PatternFill(pyargs("fgColor","C5FD2F","fill_type","solid"));
B9 = sheet_data.cell(int64(2),int64(9));
B9.value = "Total";
B9.font = ft_title;
B9.fill = bg_green;% MATLAB 2022a and newer
bg_green = PatternFill(fgColor="C5FD2F", fill_type="solid");
B9 = sheet_data.cell(int64(2),int64(9));
B9.value = "Total";
B9.font = ft_title;
B9.fill = bg_green;Merged cells
A block of adjacent cells can be coalessed into
a single cell using a worksheet’s .merge_cells() method.
The method takes a cell block range as an argument.
The example below merges the nine cells B2, B3, B4,
C2, C3, C4, D2, D3, and D4 into one.
After the merge, the cell’s handle is accessed using
the row and column coordinates of the top left cell:
# Python
sheet_data.merge_cells("B2:D4")
B2 = sheet_data.cell(2,2)
B2.value = "A Title"
B2.font = ft_title
B2.alignment = Alignment(horizontal="center", vertical="center")
% MATLAB 2020b and newer
sheet_data.merge_cells("B2:D4");
B2 = sheet_data.cell(int64(2),int64(2));
B2.value = "A Title";
B2.font = ft_title;
B2.alignment = Alignment(pyargs("horizontal","center", ...
"vertical","center");% MATLAB 2022a and newer
sheet_data.merge_cells("B2:D4");
B2 = sheet_data.cell(int64(2),int64(2));
B2.value = "A Title";
B2.font = ft_title;
B2.alignment = Alignment(horizontal="center", vertical="center");Equations
Equations are easily added to spreasheets as they are merely cells
containing strings that begin with an equals sign and an operator.
For example, to add an equation that sums values in the cell
range E2:E50, one merely populates a cell with '=SUM(E2:E50)'.
B9.value = '=SUM(E2:E50)'Putting it all together
This spreadsheet includes all customizations described above:
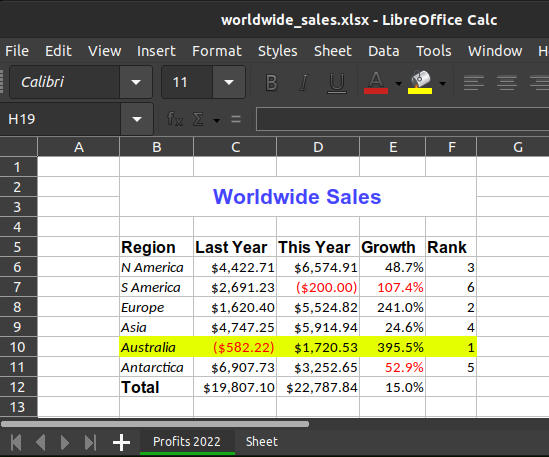
worldwide_sales.xlsx created by all_together.py or all_together.m. Note: values are randomly generated and so will vary with each run.
File: all_together.py
|
|
MATLAB 2020b & newer using pyargs():
File: all_together_2020b.m
|
|
MATLAB 2022a & newer using x=y keyword argument assignments instead of pyargs():
File: all_together.m
|
|
openpyxl can do more
Only a small fraction of openpyxl’s capabilities are
demonstrated here.
This module can also create
column filters,
2D and 3D stacked plots,
2D and 3D line plots
with optional
log scales,
bar charts,
scatter plots,
pie charts,
donut charts,
radar plots,
stock plots with high/low markers,
2D and 3D contour plots,
and
gauges.
Motivated MATLAB users will be able to make extraordinary Excel
spreadsheets with openpyxl.
Table of Contents | Previous: Read and write SQLite databases | Next: Interact with PostgreSQL